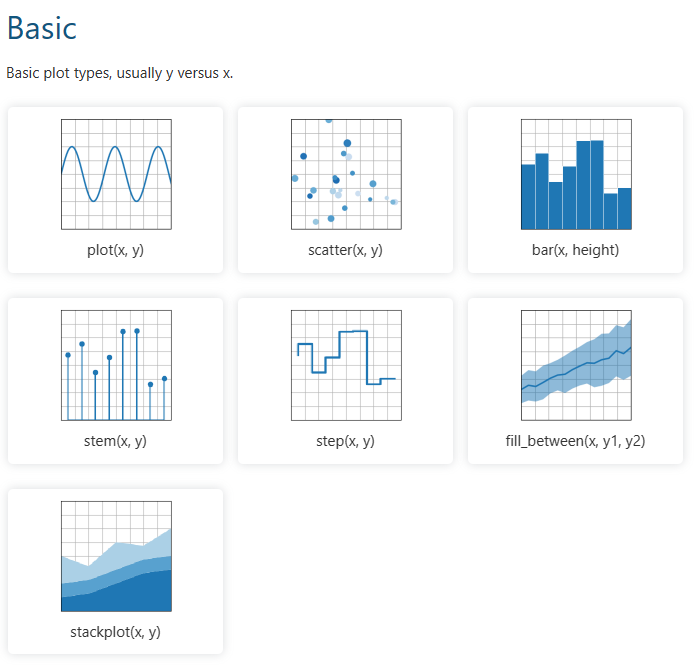
作者归档:Wesker

Matplotlib Guidelines

图的类型 Plot Type


折线图的绘制

import matplotlib.pyplot as plt

date_lst = [1,2,3,4]
stock1 = [4,8,2,6]
stock2 = [10,12,5,3]

##折线图 Line Chart
plt.plot(date_lst, stock1)
plt.plot(date_lst, stock2)
plt.show()

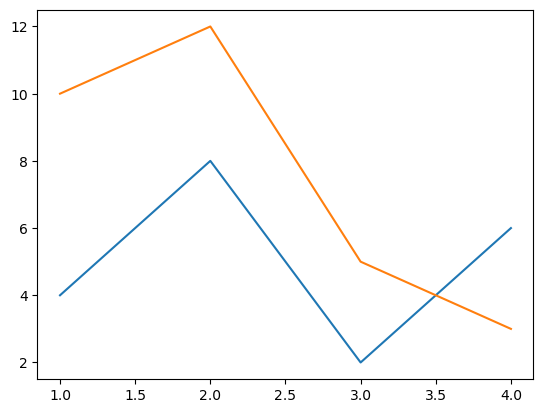
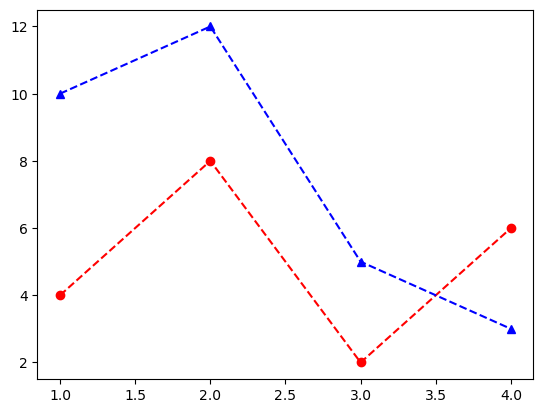
配置图形参数 Configure the plot


# line-format = '[marker][line][color]'

#add red circle marker line
plt.plot(date_lst, stock1,'ro--', label = 'Stock:abc') 
#add blue triangle_up marker line
plt.plot(date_lst, stock2,'b^--', label = 'Stock:def')

check the matplotlib website for more info about parameters

plt.title("Line Chart") 
plt.xlabel("X Label - Time")
plt.ylabel("Y Label - Price") 
plt.legend() # 添加图例 add legend
plt.show()


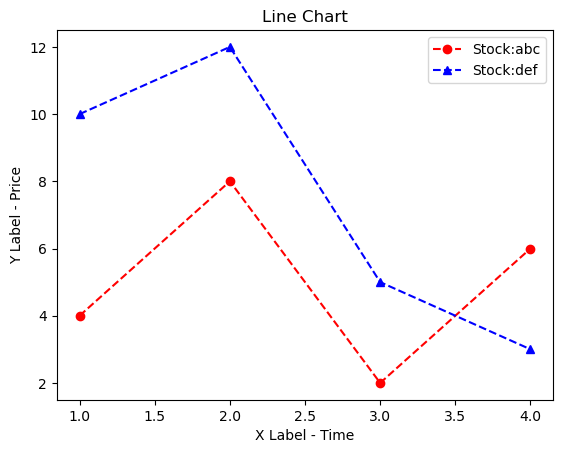
General introduction about data charts

Today, many fields use large pools of data as databases. It can be hard to analyze the data when it’s raw. To better understand how data is distributed, we may use data visualizations. In this topic, we will take a look at the ways to visualize categorical data and compare them with each other with the matplotlib library in Python.

What is categorical data?

Engineers use numerical values to develop machine learning algorithms. As algorithms generally involve calculations, it is more logical to use numeric values. But often, datasets contain various (not only numeric) values. As an example, we can take an employee table. This table can have string values such as nationality, gender, and department. They are called categorical data.

Categorical data can be of two different types: ordinal and nominal. Suppose you are hiring a new employee for a company. Before an interview, you learn about the employee’s nationality and gender. These types of data do not infer an inherited relationship. So, you cannot compare the data with each other or use them as a unit of measurement. That is why they are called nominal data. On the other hand, you can evaluate an employee’s performance during the interview. You can evaluate the employee performance as “not sufficient”, “sufficient”, and “top-notch. These evaluations are related to each other and called ordinal data.
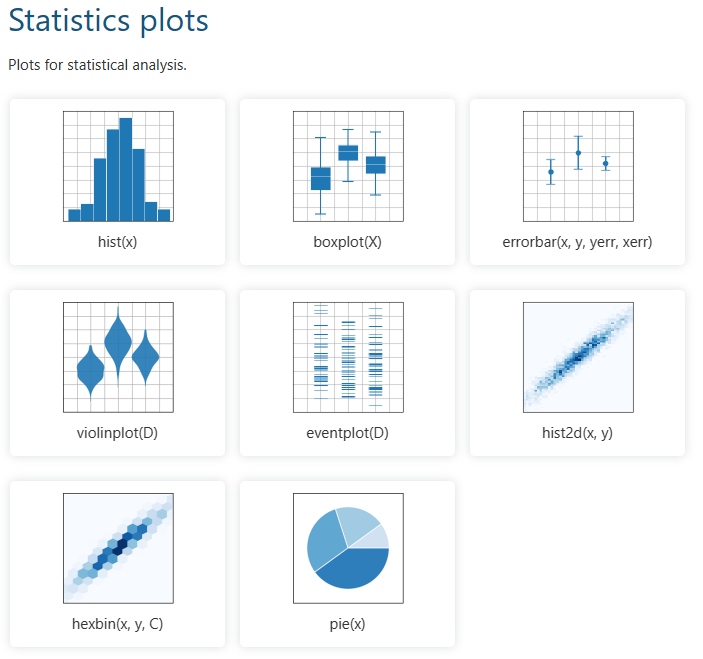
Bar plot

Today, a bar plot is probably the most popular graph when visualizing categorical data. A bar plot can display categorical data as rectangular bars. In the examples, we will use transportation modes to show categorical data:

transportation_models = {
    "WALK": 23, "BIKE": 11, "CAR": 15,
    "TRAM": 12, "BUS": 8, "TRAIN": 12
}

models = list(transportation_models.keys())
number_of_people = list(transportation_models.values())

We’ve defined two lists that keep the modes’ names and the number of people from the dictionary transportation_models. Now, let’s look at our graph.

import matplotlib.pyplot as plt

plt.figure(figsize=(6, 4))
plt.bar(models, number_of_people)
plt.title("Number of people who use each transportation model")
plt.xlabel("Number of people", fontsize=15)
plt.ylabel("Transportation models", fontsize=15)
plt.show()
Visualize categorical data with a vertical bar plot

From the graph above, we can easily see the distributions among the transportation modes. However, as the numerical difference between BIKE and TRAIN decreases, the plot may be hard to understand. But if you opt for plt.barh() instead of plt.bar(), you will get the horizontal view.

Visualize categorical data with a horizontal bar plot

In this way, it is easier to observe the difference between BIKE and TRAIN.

It is a good idea to keep these nuances in mind with bar plots. Another useful tip would be to use color reasonably. For example, you can use three different colors when analyzing the salary of your employees. If the salary is well above the average, you can use green, and if it is below, you can use red. For the rest, you can use the gray color. In this way, you can easily observe the difference between the employees. Also, sorting your data from the largest to the lowest will make it easier for you to analyze.

Stem plot

Another plot that is similar to the bar plot is the stem plot. It marks an endpoint of the data and produces a less complex graph. Now, let’s look at the code:

import matplotlib.pyplot as plt

plt.figure(figsize=(6, 4))
plt.hlines(y=models, xmin=0, xmax=number_of_people, color="blue")
plt.plot(number_of_people, models, "o")
plt.title("Number of people who use each transportation model")
plt.xlabel("Number of people", fontsize=15)
plt.ylabel("Transportation models", fontsize=15)
plt.show()
Visualize categorical data with a stem plot

As we can see in the code, we can get this graph by adding one more line. We used the plt.hlines() method to display our data horizontally. If you want a vertical plot for analysis, use plt.vlines().

Pie chart

You can also visualize categorical data in circular form with a pie chart. This chart contains multiple segments. Each segment represents different categorical data. Generally, showing these segments by percentage will facilitate the analysis. In addition, it does not have axes. Now, let’s draw a pie chart using our data:

import matplotlib.pyplot as plt

plt.figure(figsize=(6, 6))
plt.pie(number_of_people, labels=models, autopct="%1.1f%%", textprops={"fontsize": 15})
plt.title("Number of people who use each transportation model", fontsize=16)
plt.show()
Visualize categorical data with a pie chart

Since we only had six different values, it was quite easy to visualize them. However, as our data increases, an analysis may be challenging, as the area per segment will decrease. The pie chart has no axes with a round structure, so it can be hard to observe changes over time. In addition, showing the data as a percentage instead of numerical values may complicate the analysis. So, it makes more sense to work on datasets with few categories when using a pie chart.

Treemap

Another visualization method similar to a pie chart is Treemap. However, this structure does not use a circular graph. Instead, segments are represented by rectangles. First, we need to install the squarify library to use Treemap. We can do so by using the pip install squarify command. Now, we can draw our Treemap:

import matplotlib.pyplot as plt
import squarify

plt.figure(figsize=(10, 6))
squarify.plot(
    sizes=number_of_people,
    label=models,
    value=number_of_people,
    color=["#F8B195", "#F67280", "#C06C84", "#6C5B7B", "#355C7D"],
    text_kwargs={"fontsize": 15},
)
plt.title("Number of people who use each transportation model", fontsize=17)
plt.axis("off")  # Turn off the axis view
plt.show()

We used the squarify.plot() method while performing the visualization. Unlike the methods above, we assigned the colors manually. Since axes are not used in the treemap, we switched them off with the plt.axis() method. This is what our plot will look like:

Visualize categorical data with a tree map

We have shown our categorical data and their numerical values in rectangles.

Treemap can support large pools of categorical data because it displays the data as rectangles. In addition, the analysis can be much easier as it shows the data in numeric rather than percentage values. However, Treemap has some drawbacks. Treemaps do not use axes. So, we need to carry out the analysis visually. Also, as the data increases, colors can become overwhelming.

Conclusion

In this topic, we’ve learned how to display categorical data. We’ve covered two forms of categorical data. While ordinal data is interdependent, this connection does not exist in nominal data. In addition, we’ve observed that visualizing bar charts horizontally drastically improves the analysis. With a pie chart, we’ve indicated how the increase in the categorical data can affect visualization. Finally, we’ve shown that using numerical values in Treemaps rather than percentages found in a Pie chart can facilitate analysis.

Now let’s move on to the practice.

杨立华《孔子与老子》讲座

视频地址:https://www.youtube.com/watch?v=YZcl5MTPdiI

附上一个新发现的有意思的东西:《中国哲学书电子化计划》https://ctext.org/zhs

1. “常无欲以观其妙,常有欲以观其徼”

妙: 生 ; 徵:归,终,成 (王弼注)

无欲/有欲是 观物的两种状态

无欲以观其妙,从而观其生。 人为欲望的介入常常事物生长过程的败坏。 对自然界杀戮的干预,给肉打激素,都导致了事物的改变。

天地生物,人能成物,成物即成器。

人不可能无欲,人存在的本能是自我保存的冲动。

人无欲时,无法学会用器,人要有欲,才能用器。

1.1. 斯宾诺莎:欲望就是自我保存的冲动。

生命总是通过选择保存对自己有益的东西,排斥无益的东西。

1.2 《中庸》:赞天地之化育

2. 反者道之动,弱者道之用,天地万物生于有,有生于无

有是一种状态,是有限的,是有属性的,属性一种肯定,也是了无限多的否定

哲学的困境在于表达的困境,但表达的困境,不代表哲学无法被表达。

明言在表达终极实在时是有局限性的。不能名之,可谓之

2.1. 三十辐共一毂,当其无,有车之用。埏埴以为器,当其无,有器之用。凿户牖以为室,当其无,有室之用。故有之以为利,无之以为用。

无是有充分发挥作用的前提

弱者是无

做事不留余地,则做事难以为继。 企者不立(踮着脚尖站),跨者不行。留白的智慧。

王弼: 穷一家之量不能成家,一国之量不能成国,穷力举重,不能为用。 费尽力气举起来的东西,已经无法再有空闲去运用它了。

到了一定的高度,个人便不再是个人。

君之无为,臣之有为。 君主是群臣能充分发挥能力的前提

韩非子:不自用其智而用人之智,力,有。

舍身取义

自我保存和自我实现相冲突时,人倾向于选择自我实现,都有“成己”的倾向,成己是自爱的体现,而最高的自爱是忘我,关心别人。一个人真正的自爱的体现是关心别人。而当一个人关心别人时,他的格局就更大,因为他承担的更多。

自爱和自私不一样,忘我不是无我。

成己是以成物为条件,通过成就他人来成就自己。 我个人取得的 成就 是通过对别人形成的影响来表现的。就像我的技术精湛是因为能够让别人更好的体验到技术带来的快乐,我的心智的成熟是因为能够给他人带来可靠的感觉。而非给我自己带来了多少财富。(注意:这是社会层面的分析

自私是最高的不自爱,越自私的人越不幸福,幸福的人往往都有分享的习惯和倾向,自私的人越自我,自我的人得失心越重,得失心重,这辈子就只剩下四个字,患得患失。

举例:入睡困难。当转向自己时,焦虑,失眠,但转向别人时,便没有这么多的情绪。

Water Quality Data Analysis 水质分析

I. 项目初衷 Purpose of This Project

项目因日常生活中留学生群体对英国水质的批评所启发

在英中国留学生普遍认为英国水质较差,英国的水质容易引发掉发等问题,因此通过对英国水质数据进行数据分析,并与中国的水质数据的比对,客观明确地反映两国水质的差异。


II. 数据来源 Data Source

项目的数据来源于英国环境、食品和农村事务部(Department for Environment Food & Rural Affairs)官网的统计数据,数据的时间范围是2000年-2023年(注:在分析项目开始时此数据最近一次的更新在2023年的3月18号。)数据的采样点包括英国各地的海岸,河口,湖泊,池塘,水渠和地下水。

———————2023/4/13———————

乍一看官网的数据介绍,数据是有残缺的,但不知道具体是怎么样的,所以让我们下载一份看看区别在哪。

下载界面可以看到数据的整理特别的规范,这里不得不夸赞一下英国政府信息公开服务的质量。

由于我们想要研究的是整体的水质情况,这里我们只关注所有地区的数据集,或许在完成这个大项目后可以再研究一下我所在的地方的水质情况在英国大概是什么样的。

同时我们可以看到,数据集被分为了Monitoring和Compliance两类,通过搜索后发现,两者之间的区别主要在于它们的目的和采集方式。Monitoring data是通过定期采集数据,监测水体质量变化趋势,Compliance data则是根据相关规定等进行采集,旨在评估水质是否符合特定的法规、标准或规定。因此我们选择Monitoring data进行分析,因为它更适合于研究水质的整体状况。(又学到了一点专业术语的知识!)

接下来我们用Jupyter Notebook打开原始数据,由于数据内容较多,使用了pd.set_option()对版面进行了调整。

可以看到2023的monitoring文件中有110624行,17列的数据,进一步观察数据:

列名中文翻译作用和意义空值占比(%)
‘@id’样品唯一标识符用于唯一标识每个样品0
‘sample.samplingPoint’采样点标识符记录样品采集的位置信息0
‘sample.samplingPoint.notation’采样点的符号化表示法描述采样点的符号化标记信息0
‘sample.samplingPoint.label’采样点标签描述采样点的自然语言标签0
‘sample.sampleDateTime’样品采集时间记录样品采集的时间0
‘determinand.label’检测物质标签描述被检测物质的名称0
‘determinand.definition’检测物质定义描述被检测物质的定义、特性0
‘determinand.notation’检测物质的符号化表示法描述被检测物质的符号化标记信息0
‘resultQualifier.notation’结果质量限制的符号化表示法描述结果质量限制的符号化标记信息87.66
‘result’检测结果描述被检测物质在样品中的浓度值0
‘codedResultInterpretation.interpretation’被编码的结果的解释通过编码的形式描述结果的解释信息100
‘determinand.unit.label’检测物质浓度单位标签描述检测物质浓度值的单位0
‘sample.sampledMaterialType.label’样品采集的水体类型描述样品采集的水体类型0
‘sample.isComplianceSample’是否是符合检测标准的样本描述该样品是否符合特定的水质标准或法规的要求的检测样本0
‘sample.purpose.label’样品采集目的描述样品采集的目的0
‘sample.samplingPoint.easting’采样点东经描述采样点的地理坐标系统中的东经0
‘sample.samplingPoint.northing’采样点北纬描述采样点的地理坐标系统中的北纬0
数据翻译,解释及空值情况
FieldMeaningTypeOccursViews
codedResultInterpretationGives the interpetation of a coded result value.def-det:CodedResultInterpretationoptionalfull, default, compact
codedResultInterpretation.interpretationThe interpretation of a coded resultfull, default, compact
determinandThe determinand, i.e. the property that was measured.def-det:Determinandfull, default, compact
determinand.definitionThe definition of the determinand.xsd:stringfull, default
determinand.labelA name for the determinand.rdf:langStringfull, default, compact
determinand.notationA string or other literal which uniquely identifies the determinand.full, default
determinand.unitThe units in which the determinand is measured.full, default, compact
determinand.unit.labelA name for the determinand.unit.rdf:langStringfull, default, compact
resultA property for conveying the numeric value of a measurement. The units of measure for interpreting the measurement result are a property of measurements determinand. Some measurements have a coded result (determinand.unit=def-units:0992) in which case an additional codedResult property is present that which references the interpretation of the coded value.xsd:decimalfull, default, compact
resultQualifierA qualifier for the result, e.g. to indicate that the stated result is a lower or upper bound for the actual valuedef-sample:ResultQualifieroptionalfull, default, compact
resultQualifier.notationA string or other literal which uniquely identifies the resultQualifier.full, default, compact
sampleThe sample to which this measurement appliesdef-sample:Samplefull, default, compact
sample.isComplianceSampleAn attribute of a :Sample used to indicate whether the sample has been collected for a compliance purpose. The detailed purpose for which the sample has been collected can be determined by examing its :purpose property.xsd:booleanoptionalfull, default
sample.purposeA property for expressing the purpose of a water quality sample was taken.def-sample:Purposeoptionalfull, default
sample.purpose.labelA name for the sample.purpose.rdf:langStringfull, default
sample.sampleDateTimeA property for expressing the date and time that a sample was collected.xsd:dateTimefull, default, compact
sample.sampledMaterialTypeThe type of material sampleddef-sample:SampledMaterialTypeoptionalfull, default
sample.sampledMaterialType.labelA name for the sample.sampledMaterialType.rdf:langStringfull, default
sample.samplingPointAn open-domained property for making reference to a sampling point.def-sp:SamplingPointfull, default, compact
sample.samplingPoint.areaAn open-domained property for referencing an Environment Agency areadef-eaorg:Areafull
sample.samplingPoint.eastingThe easting of the point on the British National Gridxsd:integerfull, default
sample.samplingPoint.labelA name for the sample.samplingPoint.rdf:langStringfull, default
sample.samplingPoint.latThe latitude of the point in WGS84 coordinatesxsd:decimalfull
sample.samplingPoint.longThe longitude of the point in WGS84 coordinatesxsd:decimalfull
sample.samplingPoint.northingThe easting of the point on the British National Gridxsd:integerfull, default
sample.samplingPoint.subAreaAn open-domained property for referencing an Environment Agency sub-areadef-eaorg:SubAreaoptionalfull
Source: https://environment.data.gov.uk/water-quality/view/doc/reference

我们再来具体查看一下数据集的内容:

'@id', 'sample.samplingPoint', 'sample.samplingPoint.notation', 'sample.samplingPoint.label'

a. 数据集的前1-4列交代了样本采样的地点信息,除第一列是唯一值以外,其他三列都有重复的值,反映出这一年的采样主要有3670个采样点

b. 数据集的第5列为样本采样的时间信息,不难看出有写区域有不同时间段的采样记录

'sample.sampleDateTime'

c. 数据集的第6-12列为核心内容,展示了样本测定的物质及参数,是对水质特性的定量描述,通过nunique可以发现,数据集一共记录了水中508种物质的含量

'determinand.label', 'determinand.definition', 'determinand.notation', 'resultQualifier.notation', 'result', 'codedResultInterpretation.interpretation', 'determinand.unit.label'

d. 数据集的第13-17列展示了样本采集地的所属分类,以及是否合规,采集目的,地理坐标

'sample.sampledMaterialType.label', 'sample.isComplianceSample', 'sample.purpose.label', 'sample.samplingPoint.easting', 'sample.samplingPoint.northing'

这其中’sample.sampledMaterialType.label’也是对项目非常有用的信息:

水样类型描述
RIVER / RUNNING SURFACE WATER河流/流动地表水
GROUNDWATER地下水
ESTUARINE WATER河口水
GROUNDWATER – PURGED/PUMPED/REFILLED地下水-排放/泵送/补给
POND / LAKE / RESERVOIR WATER池塘/湖泊/水库水
SEA WATER海水
CANAL WATER运河水
GROUNDWATER – STATIC/UNPURGED地下水-静态/未排放
ANY SOLID/SEDIMENT – UNSPECIFIED任何固体/沉积物-未指定
ANY TRADE EFFLUENT任何商业废水
ANY SEWAGE任何污水
MINEWATER矿井水
SURFACE DRAINAGE地表排水
FINAL SEWAGE EFFLUENT终端污水
STORM SEWER OVERFLOW DISCHARGE暴雨下水道溢流排放
PRECIPITATION降水
CALIBRATION WATER校准水
ESTUARINE WATER AT HIGH TIDE高潮时的河口水
ANY WATER任何水样
ANY LEACHATE任何浸出液
MINEWATER (FLOWING/PUMPED)矿井水(流动/抽取),指从矿井中流出或通过抽水泵抽取的水样。
水体描述

分析到这里,有几点想法:

  1. ‘codedResultInterpretation.interpretation’ 这一列是需要被剔除的,因为该列所有值都为空值;
  2. determinand的选择。在水质监测中,选择合适的determinand是非常重要的,因为不同的determinand可以反映出水质的不同方面,如饮用水、水生态、工业废水等不同场景需要测量不同的determinand。而且,不同的determinand的测量方法、标准和限值也各不相同,需要根据具体情况进行选择和使用。
  3. 我对这个项目的预估还是太浅薄了。原来水质的对比也有很多种,我准备分析的是生活用水,即饮用水,和日常用水,因此需要选择RIVER / RUNNING SURFACE WATER,GROUNDWATER,GROUNDWATER – PURGED/PUMPED/REFILLED和POND / LAKE / RESERVOIR WATER四种水体的样本来进行分析
  4. “整体”的概念要如何定义?地区与地区之间已经有差异,且差异还进一步体现在于各种水体的不同,而中国和英国都是幅员辽阔的国家,要怎么确定好对比的主体?
  5. 虽然还没有开始收集中国的水体数据,但我感觉数据颗粒度应该不比英国,且数据的收集过程中,数据的真实性,数据采集的标准等都将成为误差的来源。

———————2023/4/14———————

继续这个项目的研究。在查找中国水质数据的过程中想到还有一个区别是四季的区别。但是目前来看似乎没有办法收集到像英国官网提供的那么全的数据,我试着搜了一下印度的,发现也整理的很齐全,中国的统计数据可信度暂且放一边,但信息公开的服务是真的很落后。不由得联想起之前看新闻说的28:1的官民配比,啧啧称奇。

由于无法查询到中国水质的历史数据,项目的目标需要做一些修改。

当前项目的目标为,根据中华人民共和国《地表水环境质量标准GB3838-2002》 中对I,II,III,IV,V五类地表水划分标准,对英国各地水质数据进行分类,并与中国的水质实时监测数据进行对比,从而判断英国水质情况。

中国数据:

全国地表水水质文字月报

月度国家地表水水质监测数据

国家地表水水质自动检测实时数据发布系统

先用python进行数据处理,将需要用到的物质提取出来,同时要将湖泊水,河流水和地下水提取出来,之后就可以进行对比了。

———————2023/04/16-2023/04/17———————

P.S. 这两天没怎么写文字,因为都在研究代码和数据。顺便今天是17号,收到了E·ON Next Data Analyst的拒信,好吧有点失落,看了一下Steve Jobs 的斯坦福演讲回了回血,人生无法往前串点,只能回头看时把发生过的事连接起来。所以尽量做好自己当下的事情吧!

———————2023/04/17-2023/04/28———————

项目的进展落后了很多,过程中,电脑硬盘坏了,其他生活的电器也莫名其妙地坏了,加上最近人有些emo,所以停滞了11天。现在继续这个项目。

我发现这个项目有点运行不下去,原因是,就算英国的统计数据够多,但是我发现并不是所有的采样点都满足有19个采样数据分类,因此数据处理最后得到的应该是一张有很多na值的表,所以我的评价标准也需要响应做出改变,只能退而求其次,通过比对各种已有的数据中的最低值来进行分类,做一个大概的评估。

然后过滤出核心的一些指标,像是ph值,各个分类做visualization。


附录:

关于水质硬度的介绍:

中国的国家水质划分标准:

https://www.mee.gov.cn/

内在的天使和恶魔

之前有想过,为什么影视作品里会把内在的挣扎和纠结化成天使和恶魔的形象

前阵子当我在纠结一些选择时,也偶然之间对此有了觉察

其实天使和恶魔并不是很好描述这两种思想斗争的形象,在外界看来这个人所产生的两种对立想法的利害可能是导致外界看着像是天使/恶魔,良善/恶劣的形象,但对于这个人而言,这两种选择对他带来的好处都是不同的,他仅仅是在权衡利弊而已。

我是什么时候开始有两种想法的纠结的呢?

幼稚的我只有一个想法,只有一个对的答案和解答思路,现在长大了,复杂了。

这又是好是坏呢?

如何面对寂寞

Despite being surrounded by so many people, we still lack that feeling of belonging to somebody, being accepted by somebody, being loved by somebody. How should we deal with that discontent and loneliness?

On one level, many questions are aimed towards how can I be free from this and that. Another level, you are asking how can I bind myself to something or somebody.

You must decide what is the highest value in your life: freedom or bondage? Please, I would like to hear that word.

Freedom!

But if you are free, you feel lost. If you go into the mountains and you’re totally free, that is, nobody around, nothing around you, just in the empty space of the mountains, you don’t feel free, you think you’re lost!

So to handle freedom, it needs a certain clarity and strength. Most people cannot handle freedom. They are always trying to bind themselves but only talking, mouthing freedom all the time. If you really set them free, they will suffer immensely. So this is an evolutionary issue.

In the sense human beings are right now like this caged bird, if you keep a birdcage for a long period of time and then one day you took off the door of the cage, still, the bird won’t fly. From inside, it’ll protest that it’s not free but it will not fly.

Human condition is just that. For all other creatures, nature has drawn two lines within which they have to live and die, and that’s what they do. But only for human beings, there is only a bottom line; there’s no top line.

And that’s what they’re suffering. If their life was also fixed like every other creature’s life, they wouldn’t be stressed; they wouldn’t be anxious; they wouldn’t be struggling how to handle their intelligence. And that is what you’re seeking unknowingly. You may have sought it in the form of relationships; you may seek it in the form of profession; you may seek it in the form of nationality, ethnicity, community. God, heaven, hell, all you are trying to do is draw an artificial line which does not exist.

Because freedom needs courage, freedom needs a certain madness. If you’re very sane, you cannot be free because you will go between the two lines of logic. To be free, it takes a lot of strength. That, if you first of all, what needs to happen if you want to be free is: do you understand that all human experience has a chemical basis to it?

Hello?

What you call as joy is one kind of chemistry; misery’s another kind of chemistry; stresses one kind of chemistry; anxiety, another kind of chemistry; agony, one kind of chemistry; ecstasy, another kind of chemistry. At least ecstasy, you know, it’s another kind of chemistry.

I hear.

So your experience of life has the chemical bases to it. This is a most superficial way of looking at it. There are other dimensions to it, but for you, understanding it or, in other words, what you call as myself right now, you’re a chemical soup.

The question is only, are you a great soup or a lousy soup? Yes or no?

Right now, if you have a chemistry of blissfulness, if you close your eyes, it’s fantastic; if you open your eyes, it’s fantastic; if somebody is here, it’s fantastic; nobody is here, it’s very fantastic. Yes or no?

But you have a lousy chemistry. If you look at them, if they smile at you, it’s nice, not fantastic; if they look at you like this, suddenly it’s a problem. If these people are happening just the way you want, your chemistry is reasonably balanced.

If they do something that you don’t like boom it goes somewhere else. So essentially you have not looked at this mechanism, what is the basis of this, how it functions how I can make it function at its highest level.

Right now let’s say you really blissed-out like me, do you care who is around who is not around? If they are around it’s fantastic, they’re gone fantastic. Because your experience of life is no more determined by what you have and what you don’t have, whether it’s people or things or food or this or that, it is not determined by that.

Once your way of being is not determined by anything outside of you, then there is no such thing as loneliness, but you will enjoy your aloneness because whether you like it or you don’t like it, at this young age it’s a little difficult to understand this, whether you like it or you don’t like it, within this body you’re always alone, isn’t it? Whether you do interaction or intercourse or whatever whatever whatever still you’re alone in this body, yes or no?

If you don’t learn how to handle this aloneness you have not learned anything about life, this is the most beautiful thing! The most beautiful thing about life is nobody can get here it’s just my space, yes or no? This is the most beautiful thing. Nobody can invade me they can capture me they can torture me they can do so many things but they cannot invade me, because I have a space which is just my own. Isn’t this the most wonderful aspect of your life? Don’t suffer that, that is the most beautiful thing, oh but you want to find little romantically and enjoy that what?

What are those songs and popular songs finding for somebody: without you I cannot exist, sing one song. Hold on just tell me the words I will sing, the girls should understand the guy has a need and he’s doing this it’s not really true but let’s enjoy the game right now.

Because what we do is just a certain game life is, because it comes to an end. But the important thing is how are you within yourself if you are here in such a way that you are only driven by your needs, you will live a very neither life. But if you can sit here without any need but you will do whatever is needed then you will live a magnificent life. It’s my vision my blessing every one of you must have a fantastic life. Make it happen for yourself.

当下的难过是因为回忆,不应该且也不必

现在的我在因为这个超级棒的机能而痛苦——有生动记忆的能力

现在的我难受的是一个人时的这种暂时的空虚

这种空虚过去曾经被虚假的充实所填满,但我仍旧是我,仍旧是没有完整的自己。

一个人首先要学会跟自己相处,包容接纳自己,成为一个完整的人。

人的感受是基于各种化学物质的变化,人就是一锅化学汤,而有的人选择通过慢性投毒的方式维持自己的快乐,但你不是,你是一个有更高追求的人,你要学会自我调节。


不要试图与黑暗抗争

强迫性是一种缺乏意识的表现

就像光明与黑暗

当你试图驱散黑暗时

不要试图与黑暗抗争

因为当你把灯打开时

黑暗自然会散去

如果你试图与黑暗斗争

那么你的人生将永无休止。

比较会让一个人形成意识

所以人需要比较

但也需要有意识地比较,而不是让比较带着你走。


未来的答案

在她心里我已经不是那个我,把我当成恶人的她也再也不是我爱的她。

等有钱啦,秀给她看,我要游遍山川河流,拍最好看的照片,遇见好看且一样真诚的人,和她结婚,一辈子和和美美的。

没有什么做得不好的,没有什么亏欠的。

当爱消失了,就放下吧。

写下下一个篇章的故事吧。

这不是再见,这是告别。

告别凌乱的生活,重塑我的规律生活。

有一些问题不会有答案,有一些事情总会有遗憾,也许未来会使我更完整。

有一些人会慢慢散去,也总会有人在明天等你

汽笛声打破死寂黑夜,去拥抱吧 去勇敢吧

我懂了,为什么自己战战兢兢如履薄冰

从小到大我其实生活在两个家庭里

那种“我一定要做好,做不好就会失去跟他在一起玩耍的机会”的想法是在那种高压状态下无形地产生。

我不是他们家的一员,我也没有那种无条件的爱,我受到的最大的伤害竟是来自身边的人。

梦见和发小的爸爸吵的真的很凶,心里那种恐惧的感觉也真的很明显。

爱是无条件的,如果这个人对你不好,那你要离开他。

没有感受过那种无条件爱的人,才会一直想要讨好和付出,才会在自己受到伤害的时候不知道离开。